Using Data to Predict Coastal Flood Risk

Trong Nguyen/Shutterstock.com


A new online tool compiles NOAA water-level data and storm forecasts to help coastal residents prepare for floods.
Emergency personnel, disaster readiness officials and coastal residents can track flood risk from oncoming storms with a new online dashboard that combines federal data from more than 200 water level stations.
The Coastal Inundation Dashboard, released this week by the National Oceanic and Atmospheric Administration, compiles real-time water level readings, 48-hour forecasts, storm surge and historic flooding information to give users a comprehensive picture of the approaching risk. The goal, officials said, is to give coastal residents the best chance to prepare for—and bounce back from—storm surge and rising water levels.
“Local emergency managers and coastal communities can more easily monitor water levels and make decisions before, during and after a storm to ensure they are more resilient to coastal flooding,” Nicole LeBoeuf, acting director of NOAA’s National Ocean Service, said in a statement.
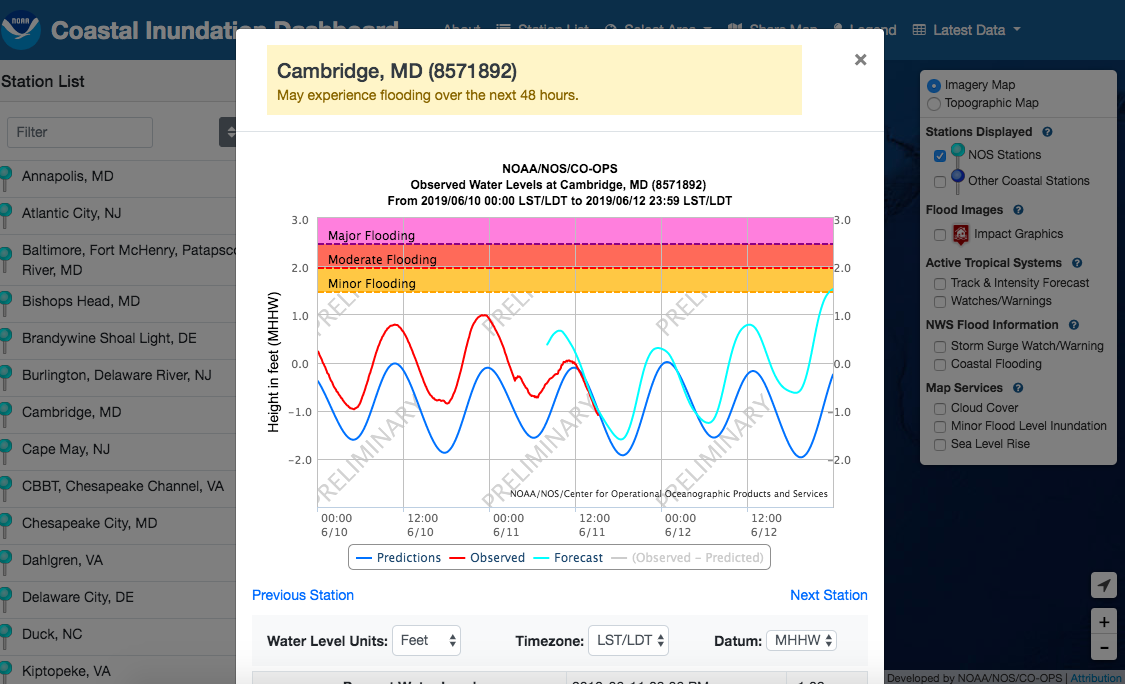
If water levels rise above a certain level at a particular station, the dashboard updates to reflect whether the flood risk is minor (low risk of property damage), moderate (threats to property and life) or major (significant risk to life and property). The baseline water levels are determined either by the National Ocean Service or local NOAA National Weather Service forecast offices.
The dashboard displays each water level station as a turquoise pin on a map of the United States. Areas with active flood risks are highlighted with pulsing red lines, and users can zoom in on specific locations by double-clicking. Once selected, each pinpoint displays the station number, observed water levels, the latest readings for wind speed and barometric pressure, and information on recent and upcoming high tides. On Tuesday afternoon, those data points predicted a minor risk of flooding for multiple locations in Maryland, including Solomons Island, Annapolis and Cambridge.
The dashboard has recreational uses as well—fishermen, boaters and surfers can access the data to pinpoint local tides.
Coastal inundation, defined by NOAA as water that’s above normally dry ground as a result of flooding, can happen in a number of ways, including abnormally high tides, storm surge, and persistent winds and waves. And it’s not limited to oceanfront communities—riverside towns and tidal estuaries are equally at risk after excessive rainfall, when water runoff can overwhelm infrastructure, resulting in flooding.
The dashboard’s release comes a week after the official start of the 2019 hurricane season, which begins June 1 and lasts through Nov. 30. NOAA’s Climate Prediction Center anticipates a “near-normal” season, with nine to 15 named storms. Four to eight of those are likely to morph into full-blown hurricanes, according to the forecast.