The Geography of Brain Drain in America

ImageFlow/Shutterstock.com


Across the United States, there are fewer states gaining brainpower than draining it, according to a new report from the U.S. Congress Joint Economic Committee.
Perhaps the biggest problem afflicting America is its widening geographic divide between the winners and losers of the knowledge economy. A raft of studies has documented the growing divergence between places based on their ability to attract, retain, and cluster highly educated and skilled workers and to develop high-tech startup companies.
Talented and skilled Americans are the most likely to move by far. While the overall rate of mobility among Americans has declined over the past decade or so, still, between one-quarter and one-third of U.S. adults have moved within the previous five years, a higher rate of mobility than just about any other country on the globe. But behind this lies a tale of two migrations: the skilled and educated “mobile” on the one hand and the less educated “stuck” on the other.
One consequence of this is that states as different as Ohio and Hawaii have been considering initiatives to stem brain drain and hold onto their own talent. In fact, such policies date back at least to the late 1990s. Back in 1999, when I lived in Pittsburgh, economic-development officials there came up with the idea of “Border Guard Bob,” a uniformed sentinel who would patrol the region’s borders to convince talented local grads to stay—an initiative that quickly became the butt of jokes and was scuttled.
Now, a new report from the Social Capital Project of the Joint Economic Committee of the U.S. Congress takes a close look at the reality of brain drain across the 50 states. The report uses U.S. Census data from 1940 to 2017, and focuses on highly educated people in their post-college and post-graduate-school years—people between the ages of 31 and 40 who are either “movers” or “leavers,” heading off to different states, or “stayers” who continue to live in their home state. (Certain maps start at 1970. There is also an interactive map with all of the data points.)
Gross Brain Drain, 2017
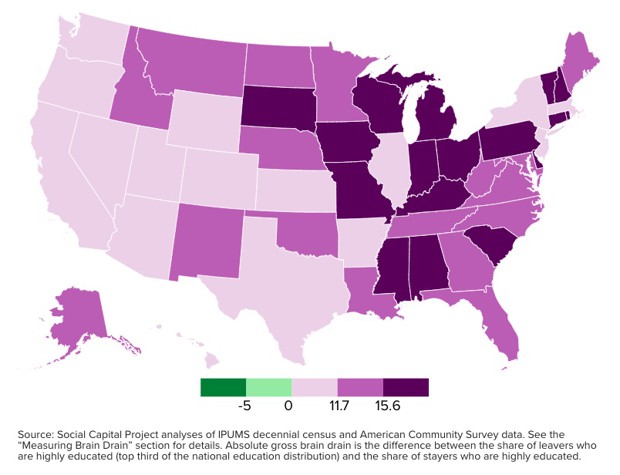
The map above shows the pattern for overall or gross brain drain in 2017. Gross brain drain is the simple difference between the share of leavers and share of stayers in a state (excluding people who move there). The biggest losers, as you might expect, span the Rust Belt, adjacent parts of the Great Plains, the South, and especially the Deep South, as well as Connecticut, Vermont, and New Hampshire in New England. The winners (lightest purple) are on the East and West Coasts, but they also include Texas and Colorado, as well as (perhaps more surprisingly) Utah, Arizona, Wyoming, and Kansas.
Change in Gross Brain Drain, 1970–2017
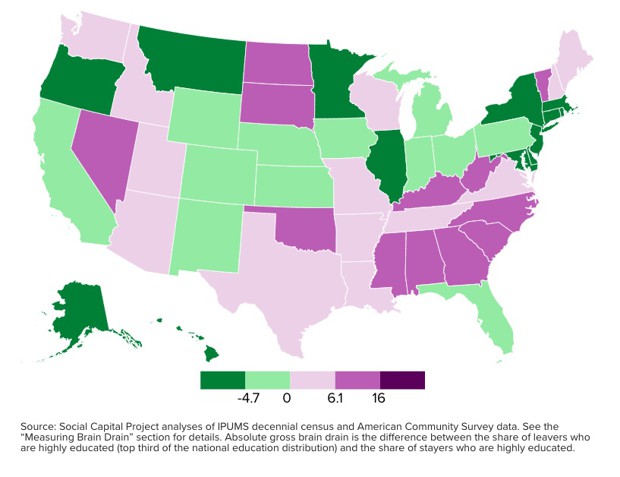
The second map (above) considers the pattern over time, charting the change in gross brain drain from 1970 to 2017. The big losers (in purple) are parts of the Rust Belt and Plains and parts of New England; the winners are shaded green. States along the East Coast’s Acela corridor, such as New York, New Jersey and Massachusetts, actually reduced their brain drain over this period, while many Southern and Sunbelt states saw the opposite pattern.
Net Brain Drain, 2017
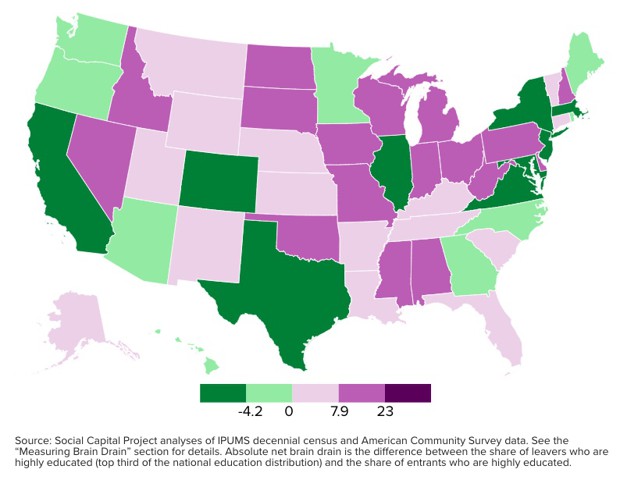
The next map (above) shows winners and losers on a different measure of “net brain gain.” This factors in new “entrants” who come from other states, as well as those leaving or staying in a given state. The winners on this measure (in green) include states on the Boston–New York–D.C. corridor and on the West Coast, as well as Colorado and Texas in the West and Illinois and Minnesota in the Midwest. The losers include, more surprisingly, states in the Rocky Mountain region and the Southwest.
Change in Net Brain Drain, 1970–2017
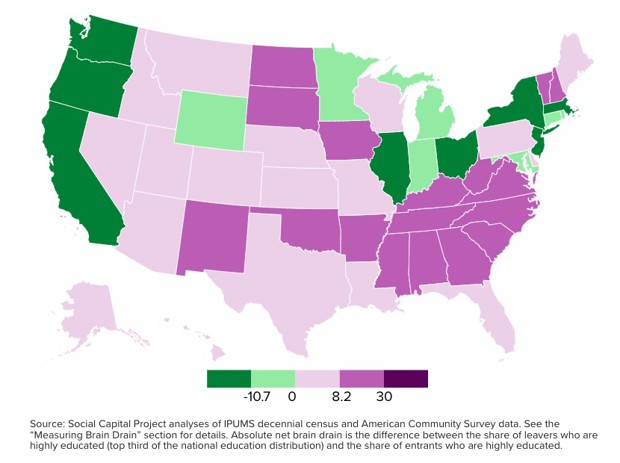
The fourth map (above) shows the change in net brain drain since 1970. Among the states that experienced big increases in net brain drain were some in the Midwest and Plains (Iowa and the Dakotas), and particularly a swath of the Southern Sunbelt. Better performers, or states that decreased net brain drain, included New York, New Jersey, Illinois, Washington, and Massachusetts. Ohio and Michigan did well on this measure, meaning they improved from being the states with the highest net brain drain back in 1970.
Bringing it all together, the best performers over the past three-quarters of a century are the states along the Boston–New York–D.C. corridor; on the West Coast; and Illinois, Texas, Colorado, Arizona, and Hawaii. States fared the worst, experiencing more brain drain, in parts of the Midwest, the Great Plains, New England, the Southeast, and especially the Deep South.
The geographic winners have only seen their advantages grow since 1970. This split geography of brain gain and brain drain poses huge implications not only for our economy, but also for American society and politics. “Brain drain has significant consequences—economic, yes, but also political and cultural,” the report notes. “By increasing social segregation, it limits opportunities for disparate groups to connect. And by siphoning a source of economic innovation from emptying communities, brain drain can also lead to crumbling institutions of civil society. As those natives who have more resources leave, those left behind may struggle to support churches, police athletic leagues, parent-teacher associations, and local businesses.”
The end result is a lopsided “winner-take-all” pattern of regional haves and have-nots. Our politics become ever more divisive and polarized as the “big sort” grows ever bigger, eating away at the social fabric of our nation.
CityLab editorial fellow Nicole Javorsky contributed research and editorial assistance to this article.