The Geography of Innovation


The suburbs generate more patents, but cities generate more unconventional innovations, a recent study finds.
Which type of place is more innovative—dense, diverse cities or sprawling, homogeneous suburbs? For most self-described urbanists, the answer would seem obvious. The density and diversity of cities enable all sorts of unique collaborations and chance encounters that foster innovation.
But this popular association between cities and innovation has long been confounded by the prevalence of suburban innovation hubs—the low-slung, car-dependent office parks that Joel Kotkin famously dubbed “nerdistans.” This term describes nearly all of the most high-profile tech hubs, including California’s Silicon Valley; the Route 128 beltway outside Boston; Seattle suburbs like Redmond where Microsoft is headquartered; and similar collections of office parks outside Austin, in the North Carolina Research Triangle, and elsewhere.
A recent study by economists Enrico Berkes of Northwestern University and my University of Toronto Rotman School colleague Ruben Gaetani cracks the proverbial code on the geography of innovation. They find that while there is actually a greater amount of innovation (as measured by patents) in suburbs, cities produce far more “unconventional innovations,” which require a greater diversity of contributors and have a more disruptive economic impact.
The study examines the locations of patents across thousands of county subdivisions as defined by the U.S. Census. It covers more than a million patents filed between January 2000 and December 2010 and granted between January 2002 and August 2014. Of the more than 35,000 total county subdivisions in the United States, slightly less than 11,000 generated one or more patents during this period; and just 1,645 were “continuously innovative,” producing at least one patent per year over the course of the study. These hyper-productive areas account for 95 percent of all patents while housing about half of the population (53 percent) and 61 percent of college grads.
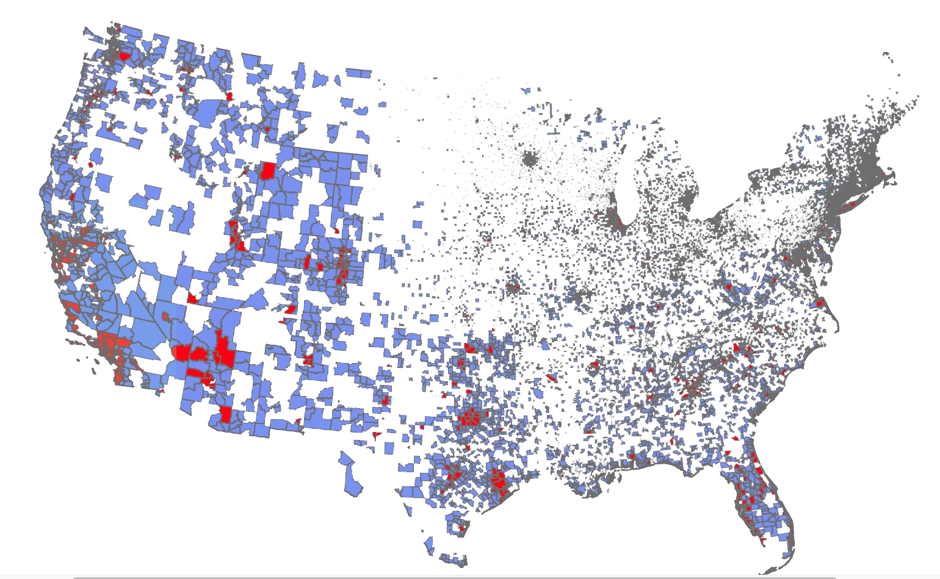
The map above from the study shows the places across the United States that produced patents. The red clusters indicate places that were continuously innovative; blue signifies places that generated patents occasionally; and blank spaces on the map represent places that did not produce any patents over the study period.
The study presents two big takeaways for understanding the distribution of innovation between cities and suburbs.
The suburbs remain a source of considerable innovation
Lower density places account for the lion’s share of patented innovations. More than 40 percent of patents come from places that had a density below 2,500 people per square mile – roughly the cut-off for urban-like density established by the urban economist Jed Kolko. And, nearly three-quarters of patents come from places that had density below 3,650 people per square mile in 2000, about the level of Palo Alto, California in the heart of Silicon Valley.
While the geography of patented innovations is highly clustered around major metros and mega-regions like the Northeast Corridor, the Bay Area, Southern California, the Texas Triangle, and Greater Chicago, a great deal of innovation occurs in lower density, more suburban locations. This is in line with my own research, which finds that the suburbs are home to roughly 45 percent of all venture capital-financed innovation areas.
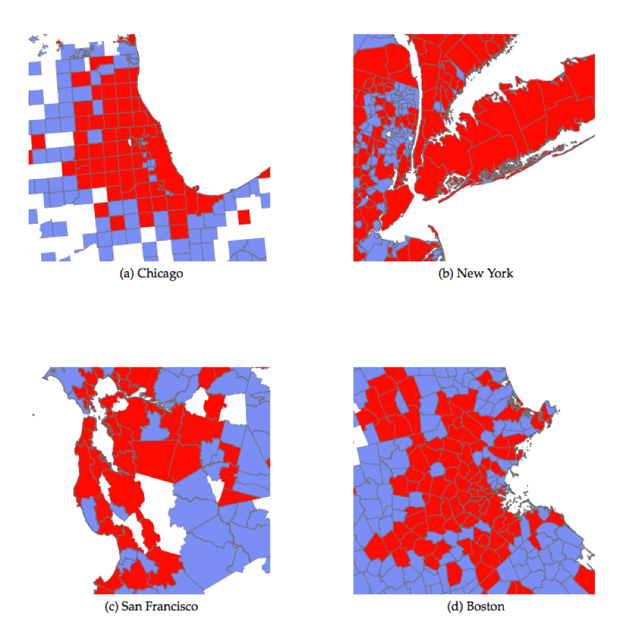
Take a look at the maps below of patent activity in and around New York, San Francisco, Boston, and Chicago (the coloring is the same as in the national map above). In every case, while virtually all high density urban areas are marked as continuously innovative, so are most of the surrounding suburbs. In fact, suburban areas of continuous innovation outnumber urban areas by a considerable margin.
The study finds that although density has a positive effect on the probability of hosting permanent innovation activities, the optimum density for patenting appears to be about 3,500 people per square mile, roughly the density of Palo Alto, Austin or Raleigh.
But higher density places produce more unconventional innovations
That said, higher density, more urban places are the source of more unique or unconventional innovations. The researchers define unconventional patents as those which are outliers in the way they combine technology categories that are seldom seen together, as inferred by the overall universe of patent citations. Unconventional patents are more likely to come from smaller companies, university labs, or independent inventors than large, publicly-traded companies. And they are often the harbingers of revolutionary new technologies.
One such patent, which cited previous patents in both the Acoustics and Information Storage categories, was filed in the dense Pacific Coast city of Santa Cruz by a Singapore-based startup called Creative Technology Limited. That patent was eventually licensed to Apple for $100 million and became an essential technology of the iPod, Gaetani explained to me in an email. He also cited the example of the Pittsburgh startup BodyMedia, which, in 2000, patented a wearable technology that monitors the wearer’s real-time health and movement data, making it an important precursor to products like Fitbit.
In other words, density plays a much bigger and more important role in the type of innovation than in the rate of innovation. In the Bay Area, for example, the areas with the highest rate of unconventional patents all had densities that were significantly greater than 5,000 people per square mile, including South San Francisco with 70 percent and downtown San Francisco with 64 percent. The rate for Silicon Valley, by contrast, was 56 percent. New York City’s rate of unconventional innovation was 56 percent compared to 44 percent in Armonk, New York, where IBM’s headquarters are located. Boston’s rate of unconventional innovation was 63 percent and Cambridge’s was even higher at 66 percent. Across the board, the places with the lowest rates of unconventional innovation were lower density suburbs. This connection between density and novel innovation is not just a product of superstar cities and knowledge hubs, but holds for metros across the board.
There are two basic reasons for this connection, according to the study. Large cities not only have deep pools of talent and a critical mass of specialists, they also have the density to forge connections between people and firms with diverse bases of knowledge. This echoes Jane Jacobs’ basic notion that cities spur innovation by fostering new combinations and recombinations of talented and creative people. In effect, large dense cities make it easier for people with good ideas to find each other.
Ultimately, the better way to think about the geography of innovation is not city versus suburb but city and suburb. If cities are the centers for more cutting-edge innovation, the suburbs remain home to the big established companies that require large campuses to house their activities and people, and which tend to engage in a lot of patenting—Silicon Valley high-tech giants like Apple, Google, Facebook and more; Microsoft in Redmond Washington; not to mention the suburban R&D centers of older-line companies like IBM, Ford, GM, Motorola, Big Pharma, and many others.
It will be interesting to track these trends in the coming years, as big companies like Amazon, Google, Salesforce, and GE invest in urban headquarters, and others, like Facebook, seek to urbanize their suburban campuses. Perhaps these companies are looking for more unconventional innovation, or perhaps they are simply reacting to broader demographic, cultural, and ecological headwinds. The benefits of urbanity, after all, go well beyond innovation.