Job Density Is Increasing in Superstar Cities and Sprawling in Others

William Perugini/Shutterstock.com


A study finds job density increased in the U.S. over a 10-year period. But four cities: New York, Chicago, San Francisco, and Seattle, accounted for most of it.
America today is increasingly defined by the overlapping divides of class and place. The country’s geography can be characterized as winner-take-all, with high-paying knowledge jobs disproportionately concentrated in coastal superstar cities, leading-edge tech hubs, and elite college towns, as large spans of the country lag far behind.
A new Brookings Institution study released this week adds to our understanding of this key trend in our uneven economic geography, documenting the deepening divide in job density across the nation.
The study, by researchers Chad Shearer, Jennifer S. Vey, and Joanne Kim, examines the degree to which jobs are concentrating or dispersing across 94 of America’s largest metro areas, which contain roughly two-thirds of all jobs. To get at this, the study uses unique data from the U.S. Census Bureau’s Longitudinal Employer-Household Dynamics Origin-Destination Employment Statistics program (or LODES), which links home and work locations for census blocks.
One caveat about the data: Because of issues with state-level reporting, it excludes six of the nation’s largest 100 metros: Boston and several other smaller Massachusetts metros; Milwaukee and Madison, Wisconsin; the parts of Providence that lie in Massachusetts; and parts of Chicago and Minneapolis-St. Paul that lie in Wisconsin. The study measures “weighted” or “perceived” job density. While the standard measure of job density basically calculates the jobs per land area, this report uses a measure of perceived job density that calculates job density of the place where the average job is located.
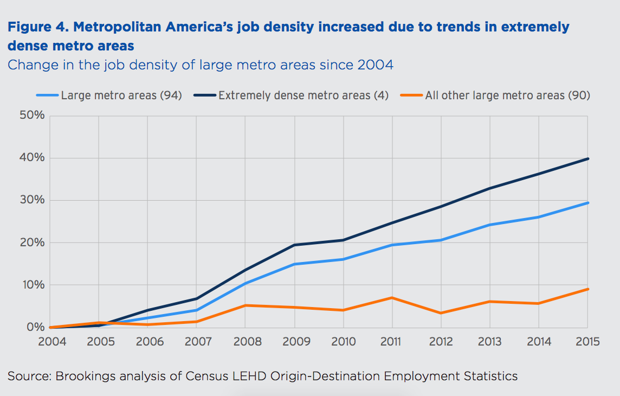
Overall, job density increased significantly between 2004 and 2015, according to the study, rising from about 20,000 jobs per square mile in 2004 to nearly 26,000 in 2015—an increase of nearly 6,000 jobs per square mile, nearly 30 percent.
But the increase in job density was extremely unequal across the county. In fact, 90 percent of it was powered by just four superstar metros: New York, Chicago, San Francisco, and Seattle. Together, these metros had an average jump of 40 percent for job density.
In the other 90 or so other metros, job density increased by an average of just nine percent, from 8,917 in 2004 to just 9,735 jobs per square mile by 2015. Overall, slightly more than half of all metros (48 of 94) saw increases in job density.
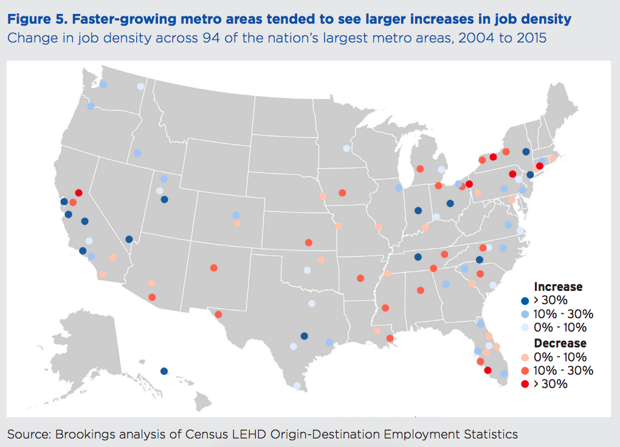
Just 15 percent of metros (14 of 94) posted above average gains in job density, including places like Nashville and San Jose but also Charlotte, Albany, and Honolulu. Another fifth of metros (20 of 94)—including places like Philadelphia; Atlanta; Boise; and Richmond, Virginia, saw their job density increase by between 10 and 30 percent.
Job density actually declined in almost half of metros (46 of 94) with a fifth (20 metros) seeing declines of less than ten percent; 14 percent (13 metros) posting declines of 10 to 20 percent; and six percent (6 metros) seeing declines of 30 percent or more.
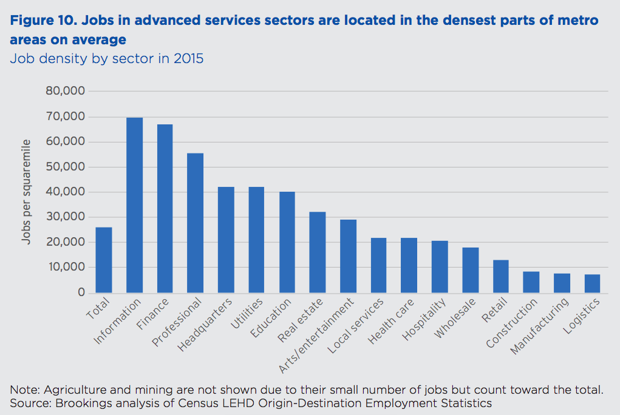
This growth in job density has been driven both by their concentration in certain cities and metros, and by the tendency of knowledge jobs in tech and advanced business services to concentrate and cluster, and to do so disproportionately in a small number of places.
The density of information-technology jobs increased by some 60 percent between 2004 and 2015—an increase that was powered by just three metros: San Francisco, New York, and Seattle. Conversely, job sprawl is much more prominent in metros with manufacturing and more routine service-based economies, where wages and incomes are much lower.
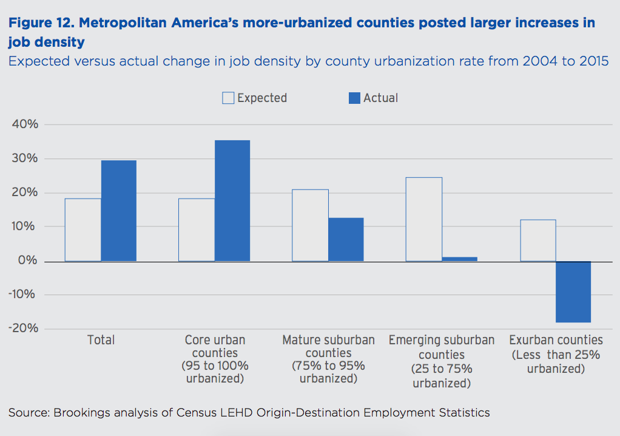
But the jobs’ divide is also fractal, occurring within individual metros as well as between them. Across the board, jobs have become denser in and around the urban core and sprawled across outlying suburban and exurban areas. As the study puts it, “jobs in metropolitan America grew both up and out from 2004 to 2015.”
Job density in core urban counties—those where at least 95 percent of people live in an urbanized area—grew from roughly 35,000 jobs per square mile in 2004 to more than 40,00 jobs per square mile in 2015, a 35 percent gain. Job density grew at less than half this rate in established suburban areas (13 percent), and barely budged in newly built suburbs (increasing by just 1 percent), while job density actually declined by 18 percent in exurban counties.
On this score, the study finds that “the pattern of job growth within different counties in the same metro area mattered just as much—if not more—to a metro area’s overall job density trends than the distribution of its job growth between core urban counties, peripheral suburban, and exurban counties.”
America is increasingly divided, and the density of jobs—as well as of people and talent—is a key fault line in its increasingly spiky and unequal economic geography. This jobs divide not only separates “winners” and “losers” across cities and metro areas, but within them. And it has grown more accentuated since the economic crisis, with the growth of knowledge jobs, decline of manufacturing, and the rise of winner-take-all urbanism.
The effects of this deepening jobs divide go beyond the economy. As the report points out, job density is associated with better heath, environmental, and civic outcomes, as well as higher rates of innovation and economic performance. It is also a key feature of America’s political divide, between denser blue places and more sprawling red ones.