Huge Data Sets Are Changing How Humans Observe the Universe
NASA
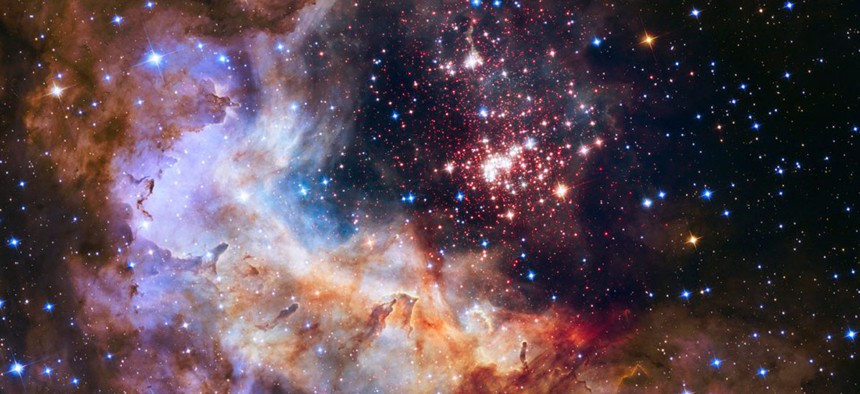
All this data is creating a new class of astronomer, one who doesn’t have to gaze skyward to understand the heavens, but instead has to go no further than a laptop.
People have long thought of astronomy as the science of looking to the stars, but discoveries in the cosmos increasingly come from a different kind of observational power. Space can now be seen in volumes and volumes of information, seemingly endless datasets with a wide range of sources. That includes a firehose of information from Hubble, a trove of old astronomical plates (old photos captured on glass instead of film) that could reveal previously unseen objects, and data from completed NASA missions that can be newly processed and analyzed with contemporary tools.
All this is also creating a new class of astronomer, one who doesn’t have to gaze skyward to understand the heavens, but instead has to go no further than a laptop.
“There is so much data that is available online that people can mine,” said Katy Garmany, a scientist and education specialist at the National Optical Astronomy Observatory in Tuscon, Arizona. “As an older astronomer, I’m stunned to talk to younger people who consider themselves observational astronomers who never go to a telescope. They simply go to a data-mining site.”
* * *
W. Patrick McCray, a professor of history at the University of California at Santa Barbara, focuses on the movement in astronomy toward digitized data. McCray says that data has always been central to astronomy, including the need for the ability to compute large volumes of data. It even goes back to the work of Charles Babbage, who conceived of the difference engine, a forerunner to modern computers, in 1882 as the head of the Royal Astronomical Society.
But in the 1960s, as the space age was just beginning, McCray says astronomers often faced a problem. They were complaining of having too little data. There were a lot of questions about our place in the solar system and universe, and not a lot of answers. In the 1970s, astronomers began to realize the need to amass large amounts of data, and many observatories moved towards creating standardized data forms.
“The idea of standardizing data is really important because if you don’t have standardized data, it’s much harder to share,” McCray says. “So if you have two astronomers who want to work together and they’re working from two different institutions with two different telescopes, unless you have a data standard, it’s going to be really hard to share data and collaborate.”
As massive caches of data become increasingly available—in many fields and industries, not just astronomy—the challenge of finding a common cataloguing system, an agreed upon way of organizing information, is increasingly pronounced. Even the most comprehensive collection of data is only as useful as the filters used to understand it.
FITS stands for Flexible Image-Transport System, an open standard file format used throughout astronomy. It provides metadata for a given image like size, location, distance, and other comments from researchers, alongside the image. The text inside the image is built in as simple of plain text as possible to be intelligible years down the line, and is designed to always make prior formats backwards compatible.
David DeVorkin, a senior curator in astronomy and space science at the National Air and Space Museum, has seen the changes in observational astronomy over the years. He says the move toward a standardized data set like FITS enabled volumes of data to be accessed in a way intelligible to the wider scientific community. With systems like FITS, anyone at any facility could build off the work of a previous astronomer without having to reverse engineer the sort of “language” it was written in.
It also broadly began a move toward codifying how that data could be reduced. That is to say, taking a wide amount of data and constraining it down to the subject at hand. In other words, organizing data so that it might yield something meaningful.
It also enables easier reduction—the process of taking a large amount of data and reducing it down to the very small. DeVorkin says the format includes not just the images, but information about the data contained in it. With each image added to fits, thus, the scientific process is integrated along with the physical image.
“They not only started standardizing the data into FITS,” DeVorkin says, but “from there, they created equations, processes, and procedures to reduce it to where they would understand that well, if you come up with that number, here’s what it means physically.”
As this process got underway, McCray says, it also became the first time that metaphors like “data floods” or “data explosions” began to fill the astronomer’s lexicon. By the 1980s and 1990s, astronomers were beginning to discuss integrated database initiatives—a compendium of existing information from observatories across the world, all centrally located—but it’s an idea that’s never quite got off the ground, mostly owing to the starved nature of funding in astronomy.
“For the last 30 years, there’s always been this desire to have better databases, better integration of databases, things like that,” McCray says. “But oftentimes when push comes to shove and budgets are getting reduced, those projects go to the bottom of the queue, so to speak, and often there’s not as much interest in doing them as opposed to building a new telescope, or launching a new space mission.”
* * *
The capacity for big data in astronomy is huge. To date, scientists have found more than 1,800 confirmed exoplanets, planets outside our own solar system. Of that number, more than 1,000 have been discovered by the Kepler Space Telescope, which spent four years on its main mission from 2009 to 2013 before its main objective was derailed by one of its wheels breaking.
But during that period, it managed to compile a vast amount of data. Exoplanets are just the beginning of what may be found in a vast amount of data left in Kepler. Even without a fully functional telescope, there are still years of data left to comb through. And that data is unusual: Kepler takes a fairly unique model in that it was a large survey of a certain region of the sky. It hunted for planets by measuring minute changes in the amount of light seen by the telescope from stars to infer the existence of planets, most commonly observing red-dwarf systems due to small orbital periods. With small orbital periods—some planets have a year that’s just a few days long—it’s easier to detect and re-detect transiting planets.
After just under two years of scanning through the data, NASA released it the public. From there, anyone could look through the data—not just researchers, but the general public. Zooniverse, an organization specializing in citizen science, built the Planet Hunters tool, meaning armchair astronomers have an opportunity to find the next Earth-like planet. In addition, NASA recently released a desktop based asteroid-hunting tool.
While using personal machines for professional data combing is nothing new—as any number of projects under the Berkeley Open Infrastructure for Network Computing initiative like SETI @ Home—these tools put the information in the hands of citizen scientists and give them the interface to do it in a simple manner. “The fact that the data are online and that anybody can access them and do things with them means that almost anybody can be part of it,” Garmany says.
But vast databases of observatory data also hints at astronomy’s future. As the volume of data grows, and pairs with a flood of virtual resources, a world emerges in which discoveries aren’t made through renting time at a telescope, but through combing through a vast amount of data.
According to Steve Lubow of the Space Telescope Science Institute, there are decades worth of data left from the Hubble Space Telescope mission that have gone largely unexamined, whether it's images of distant nebula, far-off galaxies, or blink-and-you-miss-it stellar events. Lubow, a scientist on the Hubble team, has worked on migrating the Hubble data to an easily accessible way through a public database project. He says the database enables people to build on existing data in order to refine their hypotheses, trimming overall research time.
“It’s enabling higher-level questions to be asked,” Lubow says. “People who were using a lot of time reducing data can now spend more time thinking about it and trying different things through the database.”
This sort of data use is also going to create a more enduring legacy for Hubble, beyond the two decades of astonishing images it returned. The telescope is famous for the photographs it captured of places both within our own Milky Way galaxy to those so far away that we’re peering into the near infancy of the universe. Hubble is also laying the groundwork to monitor galactic changes overtime, and making data available in real time, easier to compile way.
“We think it will go on for decades and some of the data will never be really superseded,” Lubow says. “If someone wanted a timed history of an object in space, they can use Hubble as a way to get that.”
“Even if there’s a new telescope in space, that telescope can only tell you what it’s looking at then. It can’t tell you what happened earlier. “
In fact, it’s making it possible for people to be exclusively database astronomers. “(New astronomers) don’t necessarily observe with a telescope, and it’s moving to the point that it may well be a databank that your query to observe stuff and you ask questions of that databank,” DeVorkin says.
* * *
Big-data projects are allowing observational astronomy to become a repository of information. But for radio astronomy, data is creating different possibilities. Allison Peck, the deputy project scientist at the recently completed Atacama Large Millimeter/submillimeter Array project, says that the facility uses the possibilities of supercomputing in a way that adds to the depth of knowledge available in an observational period.
“We’re not just taking pictures of the skies, but recording different channels in these frequencies, and having a lot of channels in one data set requires a significantly larger computer or a faster computer to assess the data,” Peck says.
Unlike more traditional visual methods, radio astronomy can see the invisible, like cloud density, and information about faint, distant objects to determine what they’re made of. It can peer into clouds in far off galaxies to find their composition by listening in to the frequency related to certain chemical properties, seeing the dark patches we see in galactic structures. But with more “ears” and more powerful computers, they can collect data across a wide array of spectrum, essentially taking in as much information as possible in that time.
“A supercomputer of this nature has only been possible in the last 15 to 20 years at most,” Peck says. “This type of computing advance has made it possible to add as many antennas as we want to this array, which gives us more sensitivity. We can see more of the sky at more resolution.”
Of course, this can add on to the grander picture of compiling data for later use, with similar embargo periods to visual astronomy. Like visual astronomy, it relies partly on telescopes of increasing resolution to peer at objects farther and farther. But the datasets per observational period are shorter and more manageable, about 10 gigabytes per hour or hour and a half of data, or about an iPhone’s worth of storage space, every hour and a half to two hours worth of observation time (if you have a 16 GB model). As each generation of computers advances, they’re able to build the next great instrument to listen in.
* * *
“No telescope works alone,” DeVorkin says, “That’s my motto.”
As the James Webb Space Telescope prepares for its launch in 2018, giant telescopes exceeding 80 feet in length are in the works for first light sometime in 2020, like the 30 Meter Telescope or the European Extremely Large Telescope. The last round of Phase II projects under the NASA Innovative Advanced Concepts program focused in for the most part on optics, and ways to increase resolution.
In other words, visual astronomy is by no means dead. Its sophistication simply allows for more data to be taken in, which in turn enables more discoveries to be made. Existing databases can be expanded. Discoveries that were once nearly out of the question, like finding dwarf planets in the Kuiper Belt, can be performed by running simulations over backlogs of data.
As DeVorkin points out, one feeds into the other. Vast volumes of data help narrow the observational data down to its most digestible kernal for astronomers, who can then turn their eyes toward the narrowest points to prove their assertions. We can find out more about the clouds of Venus from old Magellan data (as a various teams have been doing over the past few years, finding evidence of heavy metal frost), while other teams can take Kepler data to find not just planets like our own, but ones that giant telescopes can try to focus in on in a way Kepler was never capable of.
In the process, astronomy becomes (after the typical six-month to one-year embargo period, during which a team has exclusive rights to the data, of course) a more open-source environment. Researchers can more easily build off the existing available data to build a hypothesis, or use the existing data to identify a new target for observation.
And as the volume of data becomes more open and more intelligible, the scope of the scientific community widens, from the ivory tower of academia to the personal computer, relatively untrained astronomers making discoveries that can then be confirmed by other observational astronomers. Big-data astronomy is not just for finding comets, asteroids, and maybe the odd Pluto-like object anymore. It can be about finding far-off planets ripe for life, about unlocking unseen details close to Earth, or finding clues to understanding some of the most ancient objects in our universe.


