From Phonographs to iPhones: An American History of Gadget-Buying
petoei/Shutterstock.com


As seen in seven decades of government statistics.
If you want to get deep—and I mean really, really deep—into the technological buying patterns of the American consumer, one of the best places to start is the Bureau of Labor Statistics.
Not only has the agency tracked purchasing habits since the Consumer Price Index began in 1913, but its statisticians pay attention to a remarkable array of details. Like which refrigerator color people like best, and how preferences change over time. (White, almond, and cream-colored fridges may be the most common, but black, stainless steel, and wood are all perceived as better quality, according to government data.)
The Consumer Price Index is primarily a way for federal officials to track inflation, but the closer you look at this kind of data over time, the more you’ll notice nuanced—and not-so-nuanced—changes in the American consumer’s relationship with technology. The index doesn’t just show how spending on the same goods changes over time (although that can be revealing, too); it also tells us how technology has evolved in the United States.
Consider, for example, how the “motion pictures” of the 1940s were reclassified as “movies” by the 1950s, then specified in the 1960s to include “indoor movies”—a detail that calls to mind the popularity of drive-in theaters at the time. Or how, in 1977, CB radios and microwave ovens were added to the official basket of goods. Or how phonographs vanished from the index in the 1950s, around the same time television appeared. (And how when the television appeared, it was weighted three times as heavily as radio, meaning it was seen as more important, according to the Bureau of Labor Statistics.)
Looking at television’s trajectory is particularly telling, in part because of its overall staying power but also because of how much it has changed. In 1970, the television category was modified to include portable televisions. By 1987, television antennae and cable TV had been added to the Consumer Price Index, and the “TV set” category had been expanded to include “sound equipment” and “other video equipment.”
The 2000s saw the addition of satellite TV. Throughout all this change, televisions have taken up a smaller piece of the spending pie for Americans over time. The chart below shows how televisions went from costing Americans about 0.5 percent of their overall spending in 1966, to a tiny fraction of that (0.1) last year.
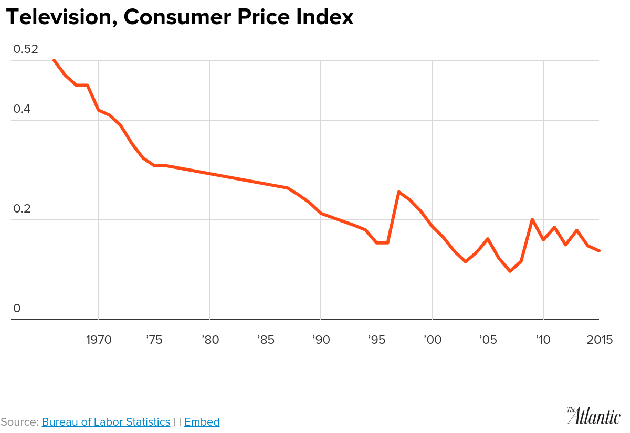
By 1994, people spent a smaller share of their money on television sets, video equipment, and sound equipment combined than they’d spent on television sets alone three decades earlier.
Before we go any further, I should say: Any attempt to analyze Consumer Price Index data this granularly requires several caveats. The agency’s methodology has changed in several ways over time; and the definition of who’s doing the buying has been refined.
Despite all that complexity, though, broader patterns still emerge if you review enough data. I combed through nearly 70 years of BLS statistics, line by line, and saw several key moments in technological history surface—like the long decline of print newspapers and the rise of television and the Internet. (Print, I was reminded, has been shrinking since the 1960s, not merely since the arrival of the Internet.)
But there are even larger shifts apparent from the data. Looking back to the 1940s, it’s clear that consumer spending on technology has gone from being dominated by home appliances, to gadgets like cameras and computers and VHS players and stereos a few decades later, to networked services like the Internet and wireless phones this century.
Back in the mid-20th century, home technology was mostly machines like refrigerators, radios, television sets, vacuum cleaners, sewing machines, and so on. By the 1980s, along with the rise of cable, there was an explosion in electronics. (“More money for cable television, legal fees, and dinners away from home,” The New York Times wrote in 1987, “Less for car repairs, red meat, dry cleaning and pastry.”)
What followed in the 1990s: a swell of spending on personal computers and software and video rentals. By then, consumer habits had changed so dramatically—largely, a result of new technologies—that federal statisticians decided it was time to overhaul the way they measured the nation’s economy.
In 1997, the Internet finally showed up on the Consumer Price Index. (It’s notable that in 1998, telephone services cost more than twice their previous peak in the 1960s; possibly a reflection of the growing popularity of dial-up Internet service.)
The 1990s also saw the addition of video cassettes, discs, and other such media—which, not surprisingly, had all but evaporated by 2015 as streaming media replaced much of the hardware of previous decades. Even the introduction of the smartphone—another form of technological consolidation—is hinted in the data: In 2008, the year after the iPhone arrived, there was a jump in the share of money spent on wireless telephony compared with landlines. (The index began tracking wireless telephone service in 2004; but it seems from the data that people began dropping landlines at a fast clip around 2010.)
But beyond broad technological patterns, a deeper analysis really depends on the type of good we’re talking about, the BLS economist Steve Reed told me.
“Bananas are what bananas have always been,” he said. “If you get to something where there’s a lot more change over time, it’s actually very complicated.”