America’s Economy app is as mixed as the economic indicators


 By
Joseph Marks
By
Joseph Marks
There’s a lot of useful information but some of it is tough to digest.
This story is part of Nextgov’s Building Better Apps project.
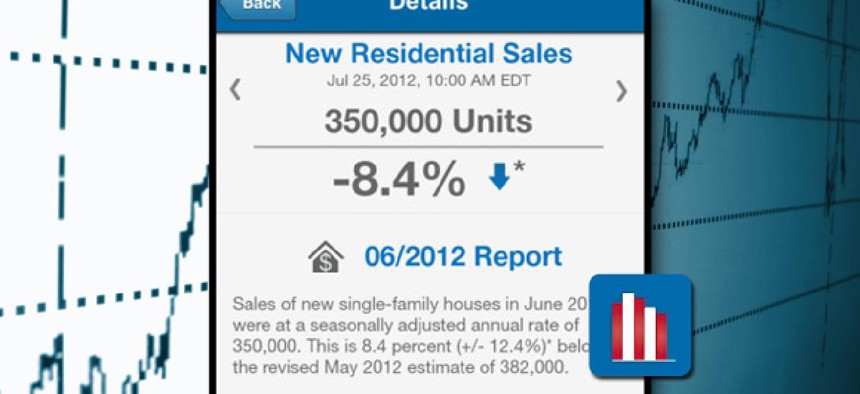
The Census Bureau’s America’s Economy app packs a lot of good economic information in one place but that may not be enough for a standalone app, our reviewers said.
The app includes frequently updated figures for 16 key economic indicators from the Census Bureau, the Bureau of Labor Statistics and the Bureau of Economic Analysis.
Our reviewers gave it 3 out of 5 points.
Matt Thazhmon, chief executive of PowerInbox, liked that he could arrange the economic indicators based on what was most important to him. The app would be more helpful if it included information about when certain figures would be updated, he said.
More color coding would also help so the user doesn’t get lost in a sea of figures, said Ted Chan, founder of PracticeQuiz.com. Green arrows for positive results and red arrows for negative ones would be especially helpful he said.
“In some cases, you have stats like the unemployment rate that are good when they are down, but others like output that are better when they are up,” Chan said.
Color coding would help the eye scan over those stats more easily, he said.
NEXT STORY: What the end of Apps.gov teaches