America's Great Science and Technology Divide

Anton Balazh/Shutterstock.com


More urban and diverse blue U.S. states score highest on an updated technology and science index.
In today’s knowledge economy, science and technology are prerequisites for economic success. But which states are America’s science and technology leaders?
A new report, the State Technology and Science Index, from Ross DeVol and his colleagues at the Milken Institute, illuminates the great divide separating America’s leading and lagging states, ranking all 50 of them on an updated State Technology and Science Index based on dozens of indicators spanning five broad categories: research and development, entrepreneurship and risk capital, human capital, the scientific and technological workforce, and the concentration and dynamism of high-tech industries.
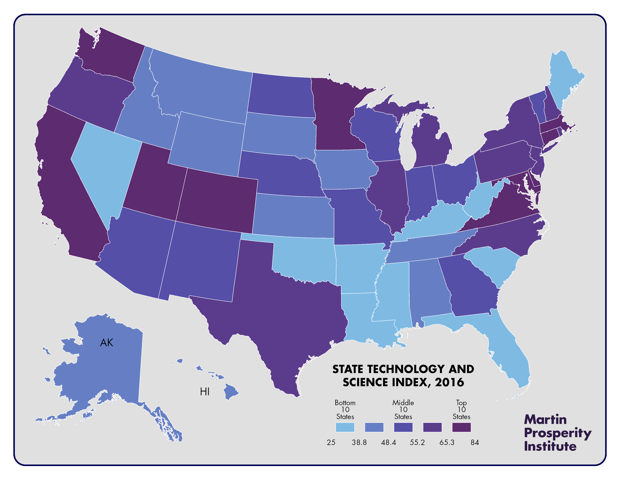
The map above by Taylor Blake of the Martin Prosperity Institute shows the broad pattern. The leading states, in deep purple, are mainly in the Northeast and West Coast, with Minnesota, Utah, Colorado and Texas also scoring highly.
The table below lists the top 10 states on the STSI. Massachusetts tops the list, followed by Colorado, Maryland, California, and Washington. Connecticut, Minnesota, Utah, Virginia and Delaware complete the top 10. There has been some shuffling of positions on the list, as the table shows.
| Rank | State | STSI | Previous Rank |
| 1 | Massachusetts | 83.67 | 1 |
| 2 | Colorado | 80.40 | 4 |
| 3 | Maryland | 80.31 | 2 |
| 4 | California | 75.94 | 3 |
| 5 | Washington | 71.84 | 6 |
| 6 | Connecticut | 71.05 | 9 |
| 7 | Minnesota | 69.58 | 12 |
| 8 | Utah | 69.14 | 5 |
| 9 | Virginia | 65.88 | 7 |
| 10 | Delaware | 65.38 | 10 |
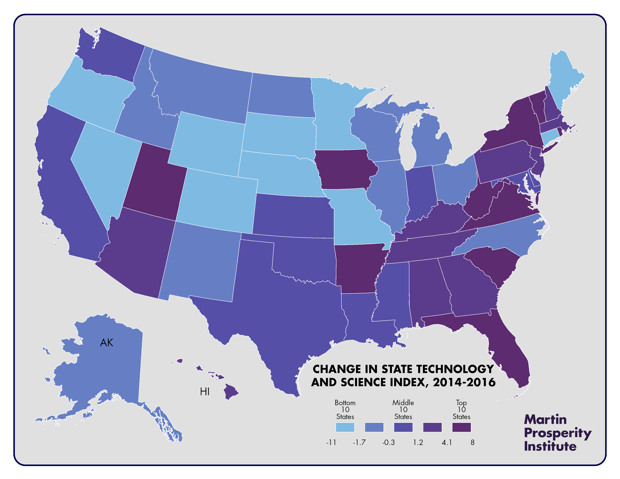
The next map shows the change in position of states from 2014 to 2016. Wyoming saw the biggest improvement, rising ten spots from 46th to 36th, while New York and Vermont saw the largest declines, the former falling from seventh to 15th, the latter declining from 18th to 26th.
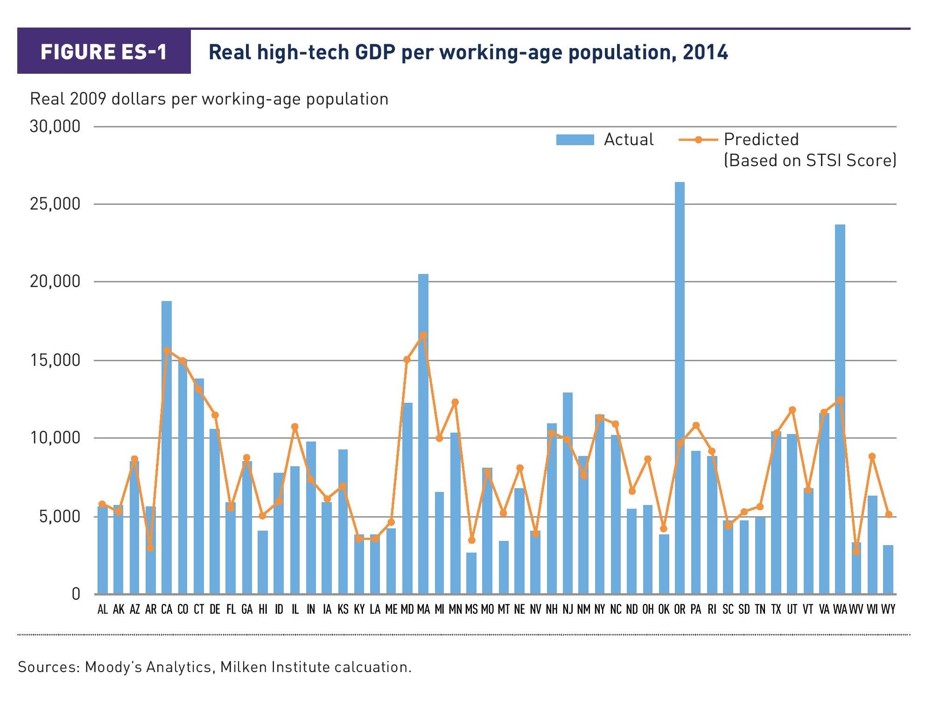
The study finds a close association between a state’s technology and scientific capability as measured by the STSI and a state’s economic success. The chart below shows the association between real high-tech economic output per capita and the STSI Index across the 50 states.
The report points out that overall, the STSI predicts about 75 percent of the variance in real high-tech GDP per worker. And once the study factors out the outlier effects of Oregon and Washington, whose tech economies are driven largely by two companies, Intel and Microsoft, respectively, the explanatory power gets closer to 90 percent.
So what kinds of states do better in science and technology?
There are certain basic characteristics that distinguish more technologically and scientifically innovative states from those that are less so. To get at this, my colleague Charlotta Mellander ran a basic correlation analysis between the Milken Institute’s STSI measure and key economic, demographic and political characteristics of the 50 U.S. states.
Economists have long argued science and technology are generators of wealth. So it’s not surprising to see states with higher scores on the STSI are also wealthier. The STSI is positively associated with wages (0.77), income (0.61), and economic output per capita (.49).
More educated states also do better on science and technology. There is an even closer connection between the STSI and the share of adults who are college grads (.84).
More innovative states are not only more affluent and educated; they are healthier and fitter as well. The STSI is positively associated with both overall well-being (.48) and the share of the population that engages in regular exercise (.59). That said, these same states are also more expensive to live in; the STSI is higher in states with more expensive housing (with a correlation of .49).
The kind of work people do factors in as well. The STSI is highly correlated with the share of the workforce who make up knowledge, professional and creative workers (.80), and negatively associated with the share that are members of the blue-collar working class (-.59).
The reality is that some kinds of creative and innovative work are more highly connected to the science and technology capabilities of states than others. It’s not surprising to see states with greater concentrations of computer scientists and mathematicians are more innovative (with a correlation of .83), as these are the kinds of occupations required to staff science and technology organizations. The STSI is also closely associated with the share of business and finance occupations (.80) and engineering and architecture occupations (.57).
What is perhaps more surprising is the close connection between the arts and the scientific and technological capabilities of states. Indeed, the STSI is more closely associated with the share of workers in arts, culture and entertainment occupations (.53) than it is with the share of the workforce comprised of scientists (.41).
Many states have invested in educational and medical institutions, so-called eds and meds, as a way to build up their high-tech capabilities and spur economic development. But we find no statistical association whatsoever between the STSI and the share of workers in eds and meds occupations.
Another thing that matters is openness to diversity. I’ve long argued innovation turns on tolerance and diversity. Scientists and technologists come from all backgrounds and ways of life. Many are immigrants. Openness to diversity is a feature that enables places to attract top scientific and technical talent across the aboard. The STSI is positively associated with both the share of the population that is foreign-born (.45) and the share that identify as LGBT (.40).
Urbanization plays a role too. Urbanists have long argued innovation requires density. More urbanized states are also more innovative. The STSI is positively associated with the share of a state’s population that lives in urban areas (.55) and negatively associated with the share that drives alone to work, a proxy measure for sprawl (-.30).
This stands in contrast to the older notion that innovation and high-tech industries grow up in suburban office parks and nerdistans like those of California’s Silicon Valley or in the suburbs along Route 128 outside Boston. Indeed, my own research has found high-tech startups coming back in large numbers to urban centers in order to attract talent.
Innovation at the state level also reflects America’s long running political and cultural divides. Liberal, blue states are more innovative than conservative, red ones. The STSI is positively associated with the share of voters who voted for Obama (.48) and who currently favor Hillary Clinton (.56). They’re negatively associated with the share of voters who voted for Romney (-.48) and favor Trump (-.64).
The sociologist Max Weber long ago argued the growth and development of Western nations was tied to their “Protestant work ethic.” But today religiosity appears to be a fetter on innovation. The correlation between the STSI and religiosity, measured as the percent of the population who say they are “very religious,” is negative (-.40).
More innovative states are also more highly taxed states, with the STSI being positively correlated with state income taxes per capita (.45). Building a state knowledge economy which requires public funding for universities and research institutes. Spending for urban infrastructure is another expensive investment, but one that ultimately pays off in the form of greater scientific and technological capability as well as higher wages and incomes.
Ultimately, the science and technology capabilities of states not only reflect, but underpin America’s underlying economic, political and cultural divides. Our most technologically advanced states are bluer, denser, more expensive, more diverse and richer, while those that lag in science and technology are redder, more working class, and falling further behind in the knowledge economy.