What big space data looked like in 1962
NASA


Fifty years ago, we recorded the learnings of our space explorers with paper scrolls.
Throughout most of human history, humans knew Venus as "the brightest star in the sky." Fifty years ago, however -- December 14, 1962 -- humanity got to know our neighbor planet in a wonderfully new way: up close and personal. On that day, NASA's Mariner 2 spacecraft sailed by Venus, at a range of 21,600 miles, scanning its atmosphere and surface for a full 42 minutes. It was the first time any spacecraft had ever successfully made a close-up study of another planet.
The result, here on Earth, was data. Much, much data. Data that disproved, among other things, a popular theory : that Venus was, as a planet, very much like Earth. Mariner 2's readings showed instead that the surface temperature on Venus was a very un-balmy 797°F on both the day and night sides -- hot enough to melt lead. They also demonstrated that Venus rotates in the opposite direction from most other planets in our solar system; that it has an atmosphere composed mostly of carbon dioxide, with very high pressure at its surface; that it features a continuous cloud cover; and that it has no detectable magnetic field. Mariner 2 also discovered new information about interplanetary space -- learning that, among other things, the solar wind streams continuously, and that the density of cosmic dust between planets is much lower than it is near Earth.
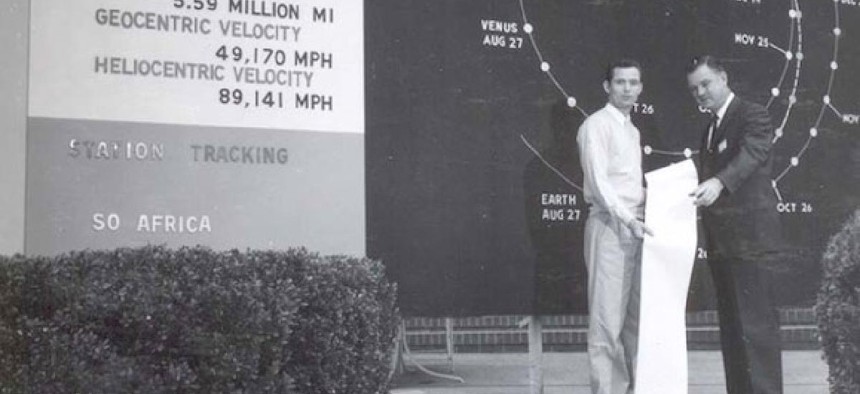
So what did all that information look like, actually? There's the billboard of data, for one thing -- painted on, apparently and tellingly, wood -- in the image above. But there's also that unfurled scroll of paper -- a paper towel roll, essentially, full of information about our neighbor planet. Which brings us, finally, to this -- the larger image of the shot above:

NEXT STORY: Agencies falter on FOIA