Debating Income Equality? Get the Facts Right with this New Commerce App
Commerce Department


A team of data gurus is hoping to transform stores of siloed government data into fresh insight into one of the toughest challenges in America.
This story has been updated.
In Greek mythology, King Midas was known for his ability to turn everything he touched into gold. Now, a team of data gurus is hoping for a somewhat similar outcome: being able to transform stores of siloed government data into fresh insight into one of the toughest challenges in America -- income disparity.
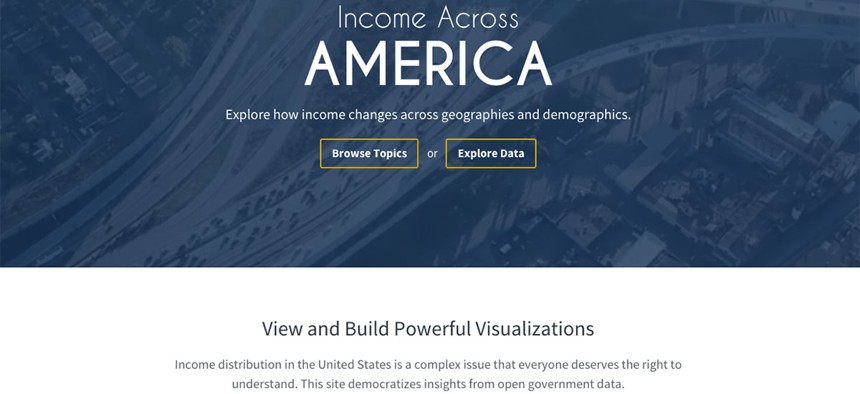
MIDAAS, short for Making Income Data Accessible as a Service, is a soon-to-be-released application programming interface, developer toolkit and website that lets Americans explore income data from the Census Bureau and the Bureau of Labor Statistics.
The idea came out of discussions about how Commerce Department data sets could be used to address income inequality, Tyrone Grandison, deputy chief data officer at the Commerce Department, told Nextgov
The end goal is to provide American consumers with “a one-stop shop for income and income and wealth discussion,” he added.
MIDAAS pulled together seven individuals from the Presidential Innovation Fellows, the Commerce Data Service and the Census Bureau for a collaborative effort: Grandison (CDS), Joshua Patterson (PIF), Michael Balint (PIF), Luke Keller (PIF), Jeffrey Chen (CDS), Jeffrey Meisel (Census) and U.S. Census Director John Thompson.
“What we wanted to do -- building off Census data -- was to really give insight into the current state of income distribution and inequality across different topics, whether it’s location, gender, race or different age groups,” said Patterson, whose innovation fellowship is with the Census Bureau.
The development took about two months, and involved a lot of prototyping and back-end work using agile processes, he added.
“Income inequality is a very difficult topic to talk about, and people generally generalize a lot of statistics about it, and the average American has to assume that the numbers they’re getting are correct,” Patterson said.
And that particular data comes in huge quantities, which naturally presents its own challenges. “When you have so much data and ability to do so many different things, you can quickly get overwhelmed,” Patterson said. “We’ve been really trying to make sure it’s user friendly and using the best UX/UI principles to really paint an interactive picture for the American public.” (UX refers to user experience and UI refers to user interface.)
The API provides access to the American Community Survey data, a statistical survey that annually samples a small percentage of the population. “It’s a very wealthy data set, but there’s never been an API that allows to pull data from it,” Patterson said
Other website features include exploratory visualizations around different curated data sets, and tools that will allow other developers to embed visual widgets to their page or use the API for their own purposes, Patterson said.
The topic sections allow a user to dive deeper into themes such as:
- How does income distribution change over time?
- Where do millennials make the most money?
- How have incomes changes in one particular city?
- What are the pay ranges for different professions?
According to a demo version of the site, Alaska, Vermont and New York are doing well in closing the income gap.
Eventually, other features will be added, including the ability to look at the difference between households with and without children, and what industries and job types have the least inequality, Patterson said.
“It’s still a work in progress; we’re still adding a lot features, functionality and polishing,” he said.
The official MIDAAS announcement and unveiling is slated for this weekend at the South by Southwest festival in Austin, Texas.